Share Value and Price Analysis
How do you determine the price of a stock share? There are two basic approaches, Fundamental Analysis and Technical Analysis.
Share Value Price Trend applies components of both Fundamental Analysis and Technical Analysis to support investment decisions.
Fundamental Analysis determines intrinsic share prices by projecting future stock earnings and then applying an acceptable return on investment to calculate the stock value and share price. This approach is used by most traditional investment analysts and is the basis of their stock performance recommendations. In a stable economic and business environment applying Fundamental Analysis should provide a solid pricing mechanism however all businesses operate in dynamic environments and future earnings are never guaranteed. This results in varying estimates of earnings. Dynamic business environments result in less reliable earnings estimates and a greater possible range of future earnings. The rate of return component of Fundamental Analysis is also variable and is influenced by the the return from alternative investments and the perceived risk of the investment. As risk increases the required rate of return increases to compensate for the risk.
Fundamental Analysis essentially tells us what price a share should be based on the variables applied. This can be considered as its intrinsic or Fair Value based on future earnings and return on investment. However the actual price of a share is determined by the market and the market is driven by human emotion. So what we really want to know is what price a share will be on the stock market within a future time window. Analyzing past share prices can provide some insight into future movements, this is the realm of Technical Analysis
Technical Analysis or Charting applies statistical techniques to historical share prices and volumes to identify likely future share price movements. It does not consider the fundamentals of the stock, the business, or economic environment as the influence of these factors is deemed to be already reflected in the share price. Because Technical Analysis is based on actual past share price data (which was influenced by human emotion) it incorporates a component of human emotion in its calculations. This can provide valuable indicators and insight into future share price movements that can not be identified using Fundamental Analysis.
At any point in time the actual stock share market price consist of two components. The Fair Value price (fundamental) and a variance from the Fair Value due to dynamic environments and human emotion. The more volatile the environment and emotion the greater the variance. This results in cyclic boom (bull) and bust (bear) markets. Achieving the best possible return for our investment requires both an appreciation of the fundamental Fair Value of a share and the future variance indicated by technical analysis.
Share Value Price Trend top +bizpep.com
Trading Strategies
The best trading strategy is an individual choice. It is dependent upon things such as our financial goals, market knowledge, risk profile, available capital, access to information, and personality. It is also worth considering some ....
Basic Tenants .....
- Share markets go through cycles, timing counts.
- Share prices are not always based on fundamentals or facts, consider market sentiment.
- Businesses go bankrupt, shares of bankrupt businesses are worthless, fundamentals do count for something.
- Serious money is made and lost trading shares; vested interests operate within the market.
- Self interest and self promotion are human traits, do your own research and make your own decisions.
- Decisions are influenced by emotion; apply logic.
- No one is correct 100% of the time; consider worst case scenarios.
- Money is valuable; treat it with respect.
- Earning money requires effort; expecting to make money without effort is gambling and introduces increased risk.
Buy and Hold
The Buy and Hold strategy is based on applying Fundamental Analysis to identify and buy shares currently priced below Fair Value. This is a long term strategy and requires limited maintenance.
This strategy depends upon the share providing the required return over a long term period.
It does not benefit from market cycles.
Dollar Cost Averaging
This is an extension of the Buy and Hold strategy where a set value investment is made over time.
It does provide some benefit from market cycles as the average cost of stocks held tends to decrease during bear markets (along with your investment).
Stop Loss
A Stop Loss is setting a sell price at some level below the buy price of a share. This is often strongly recommended by market advisers however it can result in market triggered selling of your investments at low price points.
It is designed to limit potential losses but can also be applied to lock in profits by increasing the Stop Loss sell price as the share price increases. The setting of the Stop Loss should consider underlying trends.
Diversification
Diversification reduces risk by averaging out returns. The average high is less than the highest high and the average low is higher than the lowest low. Simply holding a number of different stock shares reduces the risk from individual stock performance but it still exposes you to the same level of overall market risk. There is also an argument that over diversification has a negative impact by diluting investment focus.
Sector Rotation
Economic cycles result in different market sectors performing better at different stages of the cycle. This suggests that focusing on different market sectors at different stages of the economic and market cycle would improve returns.
In a very basic sense a sector rotational strategy involves portfolio re weighing inline with sectors of highest relative performance.
| Economy Stage | Stock Market Stage | Sectors of Highest Relative Performance |
| Bottom | Rising | Finance |
| Rising | Top | Consumer Discretionary, Property |
| Top | Falling | Materials and Resources |
| Falling | Bottom | Health, Consumer Stables |
Disregarding the economic and market cycles and simply focusing on the sector cycle provides a leading indicator for each sector.
Finance > Consumer Discretionary, Property > Materials and Resources > Health, Consumer Stables > Finance > and so it goes...
| When this Sector Peaks | Move into this Sector |
| Materials and Resources | Health, Consumer Stables |
| Health, Consumer Stables | Finance |
| Finance | Consumer Discretionary, Property |
| Consumer Discretionary, Property | Materials and Resources |
Share Value Price Trend top +bizpep.com
Share Price Trend Analysis
Trend analysis provides a simple basis for review of stock price movements.
Most charting techniques revolve around general share price trends and apply a range of sometimes complex algorithms to deliver share buy / sell recommendations.
A simple trend analysis where the price over time is plotted and from this range lines applied can provide indicators for future performance.
Share Value Price Trend applies closing price data for the period of days under analysis to calculate the trend and range of share prices over the period. From these a trend line is plotted (blue) and a High (red) and Low (green) added to determine the expected range of price and indicate possible inflection points for buy sell decisions.
This simple share price indicator leads itself to the application of a few basic trading rules:
Buy Rule
- Positive rising trend.
- Price is within the trigger % of the lower trend line.
Sell Rule 1
- Negative falling trend.
- Price is within the trigger % of the upper trend line.
Sell Rule 2
- Positive rising trend.
- Price is within the trigger % of the upper trend.
- Range is greater than the trigger % allowing a cyclical profit to be secured by re buying at the bottom of the trend.
Hold Rule
- Positive rising trend.
- Price is within the trigger % of the upper trend.
- Range is less than that required to deliver a cyclical profit.
Technical Analysis
Technical Analysis is driven by patterns within historical market share prices and volumes. It does not apply fundamental data at all on the basis that all factors that influence the price of a share are already included in past prices. These influences include human emotion. Because of this Technical Analysis can provide indicators to price movements that are impossible to identify using Fundamental Analysis.
Technical Analysis is more art than science and has both converts and critics. It applies a range of mathematical modeling and statistical techniques to determine likely future share price trends. To some these techniques appear to be valid science, to others simply an attempt at unsupported bedazzlement. Technical Analysis is often used as a black box; feed data in and act on the output; with limited appreciated of the process being applied. However perhaps the best Technical Analysis parameters are the simple ones.
Moving Average
A moving average is simply the average of a previous number of periods. In Technical Analysis it is often used with a market share price and plotted on a price versus time chart. The purpose of a moving average is to smooth out short term price fluctuations allowing underlying trends to be easily identified. The number of periods used depends on the time frame of interest, the greater the number used the smoother the plot. Moving Averages with different periods provide indicators for short and longer term price movements.
Interpretation
Moving Average is an indicator of underlying trend.
Moving Average is a lagging indicator, the greater the number of periods the greater the lag and the smoother the Moving Average. Shorter term Moving Averages crossing longer term Moving Averages signal a break in the previous trend.
Prices moving above the Moving Average indicate an up trend.
Prices moving below the Moving Average indicate a down trend.
Bollinger Bands
Bollinger Bands indicate price ranges relative to previous prices. They use a moving average as a center line and an upper and lower band each 2 standard deviations from the center line. Usually over 90% of prices will be within the Bollinger Bands, however this is influenced by the number of periods used and the price volatility. Prices outside the bands tend to indicate extreme price fluctuations.
Interpretation
Bollinger Bands are an indicator of stock price volatility.
Bands close together indicate low volatility.
Low volatility indicates a stable trading environment and continuation of underlying trends.
Bands far apart indicate high volatility.
High volatility is an indicator of change; but not necessarily reversal; of underlying trends.
High volatility is more likely to be associated with down treads.
High volatility increases short term trading opportunities.
A price above the top Bollinger Band can be used as an over brought indicator and a sell trigger.
A price below the bottom Bollinger Band can be used as an over sold indicator and a buy trigger.
Stochastic Oscillator
The Fast Stochastic Oscillator uses a %K line which indicates how close the last closing price is to the highest and lowest price for a previous number of periods. A %K of 100% indicates the last price equals the highest price for the period. A %K of 0% indicates the last price equals the lowest price for the period. A %K of 50% indicates the last price is in the middle of the high low price range for the period. When momentum is positive the last price will tend to be closer to the highest price for the period than the lowest. When momentum is negative the last price will tend to be closer to the lowest price for the period than the highest.
A %D line is also included and is a moving average of %K. %D is basically a smoother trailing %K and acts as a trigger line.
Where large fluctuations in price occur the Fast Stochastic Oscillator may exhibit false indicators. To decrease these false indicators and smooth the oscillator a Slow Stochastic Oscillator can be used. The Slow Stochastic Oscillator simply uses a %K which is the moving average of the Fast Stochastic Oscillator %K resulting in a smoother indicator but increased lag.
Interpretation
A consistently high %K indicates positive momentum or buying pressure.
A consistently low %K indicates negative momentum or selling pressure.
%K above 80% signals an over brought level. A sell trigger results when %K crosses down below %D. %K crossing below 80% confirms the sell trigger.
%K below 20% signals an over sold level. A buy trigger results when %K crosses up above %D. %K crossing above 20% confirms the buy trigger.
Money Flow Index
The Money Flow Index (MFI) uses stock price and volume to calculate an indicator of price support.
The calculation considers the value of shares traded (price * volume) for each day in the period. When the daily price is above the the price of the previous day the money flow is considered positive with buyer support, when it is below it is considered negative with seller support. The Money Flow Index is the ratio of positive money to negative money for the period.
Interpretation
A Money Flow Index above 80% is an over bought indicator, with potential reversal.
A Money Flow Index below 20% is an over sold indicator, with potential reversal.
Price changes not supported by the Money Flow Index may indicate a pending reversal. A rising price without a rising Money Flow Index may indicate a lack of buying support for the higher price and a pending price reversal. A falling price without a falling Money Flow Index may indicate a lack of selling support and a pending price reversal.
If MFI is unavailable; as it is for indexes; the Relative Strength Index RSI can be used and interpreted in a similar manner. The RSI does not consider volume.
For additional detail see Technical Analysis at Wikipedia.
Share Value Price Trend top +bizpep.com
Fundamental Analysis
Fundamental Analysis is driven by underlying fundamentals and analysts interpretation of these fundamentals. It depends upon the future Earnings per Share (EPS) and the Required Return on investment. Analysts determine an EPS based on their knowledge of the company and their views on the business environment in which the company operates. The Required Return is an assessment of risk and alternative investment returns.
Share Value Price Trend applies basic Fundamental Analysis to determine the Fair Value price of a stock share.
Calculating Fair Value also requires the return on investment to be set. This is a percentage return on the capital investment. It is set considering the return available on alternative investments and the level of risk associated with the investments. If you can achieve a 5% per annum return on a government guaranteed investment with very low risk then you would need to achieve a higher return on a riskier investment.
To maintain the inherent simplicity of Share Value Price Trend calculations do not use discounted cash flow techniques. Forecasts are based on up to three years of estimated future EPS with increasing forecast error present for longer term forecasts. The absence of discounted cash flow has negligible impact particularly considering that the underlying analysis calculates a relative value as its key measure.
Possibly the greatest downfall of Fundamental Analysis is that it can not consider the human dynamic of the stock market. However it can provide a reasonable starting point and act as a measure of share value. It can also be supplemented with Technical Analysis which applies actual historical share price data that is influenced by human emotion.
For additional detail see Fundamental Analysis at Wikipedia.
Share Value Price Trend top +bizpep.com
Market Forecast
The general sentiment of the market has a substantial impact on a stocks share price. This is evident during both bull and bear markets and contributes to the cyclic nature of stock share prices. So if we could forecast the overall market we may be able to better time our investments to maximize returns. To do this a leading indicator could provide some assistance.
The Economic Clock
The reality is that the stock market is a leading indicator of the economy and not the other way around. By the time the economy slows the market has already dropped and in fact may be starting to rise as it looks to the future economic rebound. Considering the economic cycles that tend to occur a rough indicator of the future maybe indicated by the economic clock.

While this is very rudimentary it is a starting point. A complete cycle is generally considered to be around 7 years but ranges from 5 to 15 years. From a share price perspective what the clock is indicating is to buy in gloom and sell in boom ie be a contrarian investor.
Because it is a cycle we can in use the economy as a pseudo leading indicator of the market:
- the time to buy is 1 cycle after the last time to buy;
- the time to buy is when the economy has slowed and interest rates are falling;
and just as importantly
- the time to sell is 1 cycle after the last time to sell;
- the time to sell is when the economy has expanded and interest rates are rising;
It is also worth considering that performance of a specific market sector is influenced by the economic cycle and is itself cyclic. This suggests there are benefits in a Sector Rotation trading strategy.
However the key may be in determining when the boom or gloom are approaching their peaks or troughs and managing market entries and exits accordingly. Can seasonaility and market volatility tell us anything?
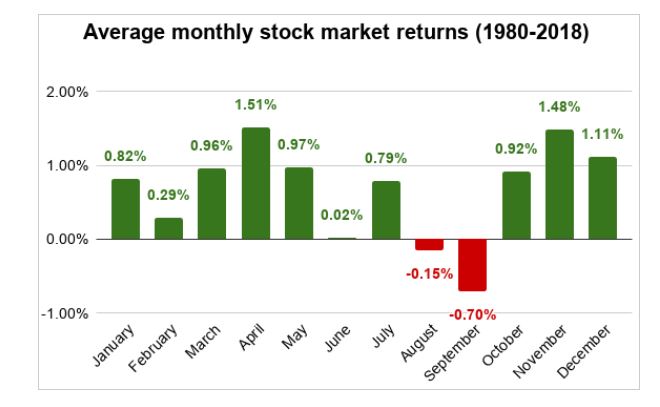
Seasonality
It's gloomier around June and September...
Market Volatility Index
Market Volatility is often gauged using the Volatility Index (VIX). This is a measure of volatility in options prices for a basket of stocks on the S&P 500. Because it is based on options it tends to be a leading market indicator.
Lower VIX values indicate a stable market and tend to be supportive of a an underlying market up trend.
Higher VIX values indicate higher market volatility and an underlying down trend. A reversal in volatility levels from a high is a potential market bottom signal.
There appears to be some support for an inverse relationship between the VIX and the stock market with both impacted by seasonality and the VIX acting as a leading market indicator:

- Increasing volatility (VIX) indicates a falling market
- Decreasing volatility (VIX) indicates a rising market
We can also apply Technical Analysis directly to the Volatility Index in the same manner as we do for a share. This can be undertaken for any index and provide additional insight.
Technical Analysis of an Index
If you add an index code to Share Value Price Trend you can undertake Technical Analysis for the index just as you would for a share. Applying Technical Analysis to an index can be provide insight into the overall market sentiment.
| Index | Yahoo Finance Index Code |
| US Indexes | |
| Dow Jones Industrial Index | ^DJI |
| S&P500 | ^GSPC |
| Volatility Index | ^VIX |
| Australian Indexes | |
| All Ordinaries | ^AORD |
| ASX200 | ^AXJO |
Why does the stock market go up?
A stock share price reflects the future earnings of the company. The only way a stock share price can continually rise is if it's earnings continually rise. Extending this the stock market reflects the future earnings of the companies it trades and the national economy. The growth of the national economy can be measured by using its Gross Domestic Product (GDP).
United States
World Bank GDP figures indicate United States GDP in 1960 was $543 billion (USD) and in 2020 $20937 billion (USD). This is a compound growth rate of %.
Applying an indicative GDP growth rate of 6.3% to an index we can calculate an expected index value for today .
In January 1995 the Dow Jones Industrial Average (^DJI) was around 4000, applying a compound earnings growth rate of 6.3% the Dow today should be .
GDP growth rates since 1995 are lower.
World Bank GDP figures indicate United States GDP in 1995 was $7640 billion (USD) and in 2020 $20937 billion (USD). This is a compound growth rate of %.
Australia
World Bank GDP figures indicate Australian GDP in 1960 was $18 billion (USD) and in 2020 $1331 billion (USD). This is a compound growth rate of %
In January 1995 the Australian All Ordinaries (^AORD) was around 2000, applying a compound earnings growth rate of 7.4% the All Ords today should be .
GDP growth rates since 1995 are lower.
World Bank GDP figures indicate Australian GDP in 1995 was $367 billion (USD) and in 2020 $1331 billion (USD). This is a compound growth rate of %
Current Stock Market Forecast Calculator
You can use the following Stock Market Forecast Calculator to forecast where the stock market would be if compound growth was applied over a period from a previous market reference point. This forecast can provide insight into potential market swings. When the market is above the forecast a bull market is indicated, when it is below the forecast a bear market is indicated. Due to compounding small variations in values applied will have significant impact on results. For best results the starting index level and year should be selected to reflect a stable mid range point within a previous market cycle. The compound earnings growth should reflect the average GDP growth for the economy represented by the index.
Standard indexes do not usually incorporate dividends paid and these returns will not be reflected in index values. Average United States market dividends range around 2% pa. Average Australian market dividends range around 4% pa.
Price Earnings Ratio as a Market Forecast Indicator
Lets consider what might happen to a stock's share price, EPS and PE during an economic cycle. We will use a very basic approach with nice round numbers.
During stable economic conditions (ie no change) a stock with a current and future EPS of $1 per annum where investors require a 10% Return on investment the stock price will be $10.00 and the PE will be 10.
Stock Price = EPS / Required Return %
Stock Price = $1 / .1 => $10.00
PE = Stock Price / EPS
PE = 10 / 1 => 10
This is Fair Value and can be calculated using Share Value Price Trend.
Investors then begin to believe that the economy is starting to grow so they increase what they think the future EPS will be to $1.50, the stock price rises to $15.00. But because the current earnings have not increased only the possible future earnings the current PE also rises to 15.
Stock Price = $1.50 / .1 => $15.00
PE = 15 / 1 => 15
So an increasing PE may indicate an increasing stock price.
If the forecast EPS becomes reality then the price holds and PE drops accordingly
PE = 15 / 1.50 => 10
So an decreasing PE may indicate a stable stock price.
This indicates in a rising stock market we would expect the PE to rise and fall over time but trend higher not lower.
Now lets consider the reverse where investors begin to believe that the economy is starting to contract so they decrease what they think the EPS will be to $0.50, the stock price drops to $5.00. But because the current earnings have not decreased only the possible future earnings the PE also falls to 5.
Stock Price = $0.50 / .1 => $5.00
PE = 5 / 1 => 5
So an decreasing PE may indicate a decreasing stock price.
If the forecast EPS becomes reality then the price holds and PE rises accordingly
PE = 5 / .50 => 10
So an increasing PE may indicate a stable stock price.
So in a falling stock market we would expect the PE to rise and fall over time but trend lower not higher.
So far it does not really tell us much but if we can determine when a market changes from rising to falling and visa versa perhaps then it is worth considering. There is some evidence that underlying changes in PE do provide some indication of changes in the market. In the article Is the P/E Ratio a Good Market-Timing Indicator? Matt Blackman back tests a buy sell trigger pattern using 2 and 5 year moving averages of PE Ratios. The trigger is changes in PE trend. This back test confirms ...
A change in underlying PE trend from rising to falling is a market exit trigger.
A change in underlying PE trend from falling to rising is a market entry trigger.
You can compare the inflation adjusted Shiller SP500 PE Ratio and SP500 Price to see the strength of the relationship.
Share Value Price Trend top +bizpep.com
Trading Rules
Identify the underlying trend, falling trends are high risk. Do not chase stocks down, wait for reversal.
Moving Averages provide an indication of trend. Price ranging above the moving average toward the top bollinger band indicates a rising trend, ranging below towards the bottom bollinger band indicates a falling trend. Shorter term Moving Averages crossing longer term Moving Averages signal a break in the previous trend.
Prices oscillate within trends. If a price oscillation pattern can be identified project the next low and high price points (considering the current trend) and the oscillation period to determine when the next low and high are likely to occur. Review previous support and resistance levels. Consider overall market trends and strategy. Within the window of opportunity apply buy/sell trading rules....
Buy Rules
%K on the Slow Stochastic Oscillator moves upwards from below 20% and crosses above %D.
and
Money Flow Index (MFI) / Relative Strength Indicator (RSI) increasing from preceding trend.
OR
In a flat or rising trend price drops below the bottom Bollinger Band and is followed by a higher low or there are strong previous support levels at least twice the level required for a profitable trade.
Sell Rules
%K on the Slow Stochastic Oscillator moves downwards from above 80% and crosses below %D.
or
Price above the top Bollinger Band.
AND
Money Flow Index (MFI) / Relative Strength Indicator (RSI) decreasing from preceding trend.
Share Value Price Trend top +bizpep.com
Review all positions regularly. Be wary, the market is driven by human emotion and self interest. If you are not comfortable do not partisipate. All investment opinions are flawed, make your own assessments. It is your money and ultimately you are solely responsible for the positive or negative value it returns to its owner.
For additional analysis and information see our Share Investment Insight Resources...