Forecast Budget
Forecast Budget Download Help License +bizpep.com
Build a 3 year Business Forecast with Sensitivity Analysis and a 12 month Budget
Forecast Budget is a streamlined tool for developing a 3 year business forecast and a 12 month budget. It requires minimal inputs and generates Optimistic to Pessimistic forecasts for your business. From your forecasts a 12 month master budget is built. You then have the capacity to refine this budget as required. The methodology used applies relationships between current data and relative indicators for future performance to produce a verifiable budget quickly and easily. This forecast and budget tool can be utilized for existing and proposed businesses, products, or services. Outputs include a 3 Year Forecast with Sensitivity Analysis, and a Budget by Month in tabular and graphical form.
Forecast Budget Download Help License +bizpep.com
Download Forecast Budget
![]()
![]() Download Forecast Budget - Compressed Zip file
Download Forecast Budget - Compressed Zip file
forecastbudget.zip
or
![]()
![]() Download Forecast Budget - .xlsm file
Download Forecast Budget - .xlsm file
forecastbudget.xlsm
This application is a macro-enabled spreadsheet developed in Microsoft Excel and will only function when opened using a spreadsheet program with macros enabled. You can download Forecast Budget free of charge for evaluation. In evaluation mode some functionality is restricted. To license your application and fully enable all functions requires the purchase of an application license. If you have not already please consider buying a license to fully enable your application.
If you download the Compressed Zip file unzip/uncompress the downloaded file and save the content .xlsm application file. If you download the .xlsm file simply save the .xlsm file. Open the .xlsm file and follow the instructions. Macros must be enabled for this application to function. If you cannot access input or command buttons do not operate macros are not functioning. In this case please refer to your spreadsheet help to enable macros. This application does not access or alter your system or system files in any way. To uninstall simply delete the saved files.
Application suitability must be independently assessed and use indicates acceptance of any and all associated risk.
Forecast Budget Download Help License +bizpep.com
Help Forecast Budget
All inputs are in Blue cells on the Input, Analysis, and Budget Sheets. Click the tab, hyperlinks or buttons to access. In evaluation mode some inputs are locked (gray cells).
Current Operating Performance Data
This section reviews the current performance of your business for a full year period. It is designed to assess the level of expenses that vary with your sales (Variable Costs) and those that don't (Fixed Costs). It also allocates a realistic labor cost for the owners effort. The focus is on cash flow excluding assets and taxation. Broad expense categories are provided. Values can be based on the previous years tax return adjusted for current trading. Inputs do not have to be perfect but should reasonably reflect business operation. It forms the starting point for your budget. If you are building a budget for a new business or product input estimated base Revenue, Variable Cost and Fixed Cost data. To estimate your Base data annualize your expected trading for the first month (multiply it by 12). This will provide a reference point. Ensure your Variable Cost ratios are reasonable and the Fixed Costs reflect a full years trading.
Business Name or Identifier
Input a name for the business. This appears as an identifier on the Output Sheets.
Business Revenue
Input the Revenue generated by the business for the current year.
Expenses
Select your Expense input as Monetary or Percent. This allows you to input your Expenses directly in Monetary (Dollars, Pounds etc) or Percentage terms.
Variable Costs
Variable Costs vary with the volume of product or service you provide. Only include these costs in this section and allocate them into one of the six categories.
Materials & Supplies
Input the annual variable expense for materials and supplies directly related to producing your product or providing your service.
Labor excluding Owner
Input the annual variable expense for labor (excluding the owner) directly related to producing your product or providing your service. Labor expenses should include all associated on-costs and benefits.
Labor Owner
Input the annual value of labor provided by the owner that is directly related to producing your product or providing your service. This variable expense should reflect the effective labor effort and can be estimated as the cost of an employee who could replace the owner. Labor expenses should include all associated on-costs and benefits.
Distribution
Input the annual variable expense for distribution of your product or service. This may include freight costs, packaging, and vehicle running costs.
Marketing
Input the annual variable expense for marketing. Include advertising, promotional publications, sponsorships, client functions, and any marketing or sales expense. Marketing is not essentially a variable expense, however it is assumed that marketing does influence the level of sales and a relationship exists between the level of marketing and the level of sales. It is on this basis that it forms a component of variable costs.
Other
Input any annual variable expenses not already accounted for.
Total Variable Costs
This is the sum of the variable expenses. It is expressed as a monetary value and as a percentage of revenue.
Fixed Costs
Fixed Costs are expenses which remain constant (up to a point) while the volume of sales vary. Only include these costs in this section and allocate them into one of the six categories.
Location
Input the annual fixed location expense. Include rent, power and light, maintenance, building insurance, security, and cleaning. If you own the property do not include purchase or finance costs.
Administration
Input the annual fixed administration expense. Include office phone, equipment rental costs, and stationary.
Labor excluding Owner
Input the annual fixed labor expense (excluding owner). This should include any labor expense not already accounted for in variable costs. Labor expenses should include all associated on-costs and benefits.
Labor Owner
Input the annual value of fixed labor provided by the owner. This should include the value of any labor not already accounted for in variable costs. This fixed expense should reflect the effective labor effort and can be estimated as the cost of an employee who could replace the owner. Labor expenses should include all associated on-costs and benefits.
Interest Costs
Input the annual fixed Interest Cost. Include only the interest component of loan repayments. Principle components reflect assets.
Other
Input any annual fixed cost expenses not already accounted for.
Total Fixed Costs
This is the sum of the Fixed Cost expenses. It is expressed as a monetary value and as a percentage of revenue.
Operating Surplus
Operating Surplus reflects the before tax operating profit/loss of the business for the full years trading. It is calculated as the Revenue less Total Variable Costs less Total Fixed Costs. It excludes asset investment. Assets include property, equipment, and capital reinvestment in the business. The Operating Surplus represents the day to day (short term) business performance.
Owner Cash Flow
Owner Cash Flow is the Operating Surplus plus the value of any Labor provided by the Owner. If the owner provides no labor for the business Owner Cash flow and Operating Surplus will be equal.
Forecast Data
This section considers factors that influence future business performance. A relative indicator is used to reflect unit changes in these factors. The base year relative indicator for each factor is defined as 100%. Relative indicators for each of the next three years are applied to reflect likely changes in the unit cost or strength of the factor. Each indicator is relative to the prior year. A 10% increase from the previous year is reflected by a relative indicator of 110%. A 10% decrease from the previous year is reflected by a relative indicator of 90%. Relative indicators for costs reflect changes in the base unit of the expense such as labor costs per hour or material costs per unit.
Relative Indicator
Relative Indicators are required for each factor for Years 1 to 3. If there is no change from the previous year the Relative Indicator is 100%. You have provided Revenue and Costs details for the Current Year. Year 1 is the year following the Current Year, Year 2 follows Year 1, and Year 3 follows Year 2.
Level of Competition
Input the percentage relative indicator to reflect the level of change from the previous year. Consider the number of competitors, competitor strategies, potential new entrants. This indicator has an inverse relationship to forecast Business Revenue. All things being equal as the level of competition increases Business Revenue decreases.
Market Strength
Input the percentage relative indicator to reflect the level of change from the previous year. Consider market growth, technology & regulatory impacts and customer needs. Market strength is an indicator of the demand for the type of product or service you provide. This indicator has a direct relationship to forecast Business Revenue. All things being equal as market strength increases Business Revenue increases.
Materials & Supplies Costs
Input the percentage relative indicator to reflect the level of change from the previous year. Consider the potential changes in supplier pricing, sources of supply, your bargaining power, demand for materials, and possible alternative materials. This indicator has a direct relationship to forecast Materials & Supplies expenses. All things being equal as the unit cost of materials and supplies increases this variable expense increases.
Labor Costs
Input the percentage relative indicator to reflect the level of change from the previous year. Consider market forces and availability of skilled staff. This indicator has a direct relationship to forecast variable and fixed Labor excluding Owner, and Labor Owner expenses. All things being equal as the unit labor costs increase these labor expenses increase.
Interest Rates
Input the percentage relative indicator to reflect the level of change from the previous year. This is percentage change not actual values. For a current interest rate of 6% a relative indicator of 110% in Year 1 equates to 6.6%, a relative indicator of 110% in Year 2 takes this to 7.26%. This indicator has a direct relationship to forecast Interest expenses. All things being equal as interest rates increase this fixed expense increases.
Business Market Position
Input the percentage relative indicator to reflect the level of change from the previous year. Consider your position in the market, and the impact of your current actions. This is a measure of your standing relative to the competition as perceived by potential consumers. If things will remain much the same input 100%, indicating no change over the previous year. If you have actions to improve the position of your business by 10% then the input would be 110%. This indicator has a direct relationship to forecast Business Revenue. All thing being equal as market position increases Business Revenue increases. Actions contributing to the business position must be substantiated and implemented to have an impact.
Variable Cost Efficiency
Input the percentage relative indicator to reflect the level of change from the previous year. This should reflect changes in the relationship between your variable costs and revenue. If you have actions to improve your variable cost efficiency (decrease variable costs) by 10% over the previous year input 110%. Consider changes in processes, distribution or the materials used. This indicator has an inverse relationship to forecast variable Materials & Supplies, Labor excluding Owner, Labor Owner, Distribution, Marketing and Other expenses. All things being equal as variable cost efficiency increases less materials, labor, distribution and marketing resources are required resulting in a decrease in these expenses. Actions must be substantiated and implemented to have an impact.
Fixed Cost Efficiency
Input the percentage relative indicator to reflect the level of change from the previous year. Consider changes in administration processes and fixed labor requirements. This indicator has an inverse relationship to forecast fixed Administration, Labor excluding Owner, Labor Owner, and Other expenses. All things being equal as overhead efficiency increases less administration and labor resources are required resulting in a decrease in these expenses. It does not apply to Location and Finance expenses. Actions contributing to the business position must be substantiated and implemented to have an impact.
Fixed Cost Flow-on
Input the percentage Fixed Cost Flow-on. This indicates the estimated level of fixed cost adjustments to support revenue variations. Fixed Costs are generally considered a constant expense, however large sustained revenue variations place pressure on fixed costs and usually result in an increased fixed cost expense. This may include larger floor area, more administration costs, or higher financing. The Fixed Cost Flow-on percentage is the amount of increase in fixed cost expense for a 100% increase in revenue. An Fixed Cost Flow-on of 20% reflects a 20% increase in fixed cost expense for every 100% increase in revenue. If you own your property only the Interest Costs of the financed amount will be adjusted by the Fixed Cost Flow-on. This indicator has a direct relationship to all forecast fixed cost expenses. All things being equal as the Fixed Cost Flow-on increases the fixed cost expense relative the revenue will increase.
Owners Time Commitment to Business
Input the percentage of work time the owner commits to the business. This is used to determine the owners return for effort and indicates the available amount of owner resource. Available resource will be applied to any forecast labor increase in fixed, then variable costs where the owner currently contributes.
Replacement Value of Business Assets
Input the replacement value of physical business assets. Exclude property. Consider vehicles, plant, and equipment. Annual replacement costs for these business assets are calculated as the Replacement Value divided by the Asset Life. This provides for constant reinvestment to maintain the business. Property (Real Estate) is treated as a constant, depreciation and capital gain are assumed to balance each other out.
Life of Assets (years)
Input the average life of the assets. The Replacement Value of Business Assets will be divided by the Life of Assets to provide an indication of annual asset Depreciation Allowance. This will be used in determining the Business Return.
Sensitivity Analysis
Sensitivity Analysis allows you to adjust your Relative Indicators by a set percentage to generate Optimistic and Pessimistic Forecasts.
Optimistic Input
Input the percentage improvement in Relative Indicators to generate an Optimistic Forecast. If you feel it is "reasonably likely" your Relative Indicators may be 20% too low, input 20%.
Pessimistic Input
Input the percentage degrade in Relative Indicators to generate a Pessimistic Forecast. If you feel it is "reasonably likely" your Relative Indicators may be 20% too high, input 20%.
Business Revenue
This is the forecast revenue generated by the business.
Optimistic
This is the forecast based on your Optimistic improvement to Relative Indicators.
Expected
This is the forecast based on the Relative Indicators you provided as input.
Pessimistic
This is the forecast based on your Pessimistic degradation of Relative Indicators.
Operating Surplus
This is the Revenue less Variable and Fixed costs. The Operating Surplus represents the day to day (short term) business performance.
Business Return
Business Return is the Operating Surplus less a Depreciation Allowance. A Depreciation Allowance is required for the long term maintenance of the business. It is calculated as the Replacement Value of Business Assets divided by the Asset Lifetime. If the Depreciation Allowance is not reinvested business performance will decrease. The Business Return provides a longer term indicator of business performance.
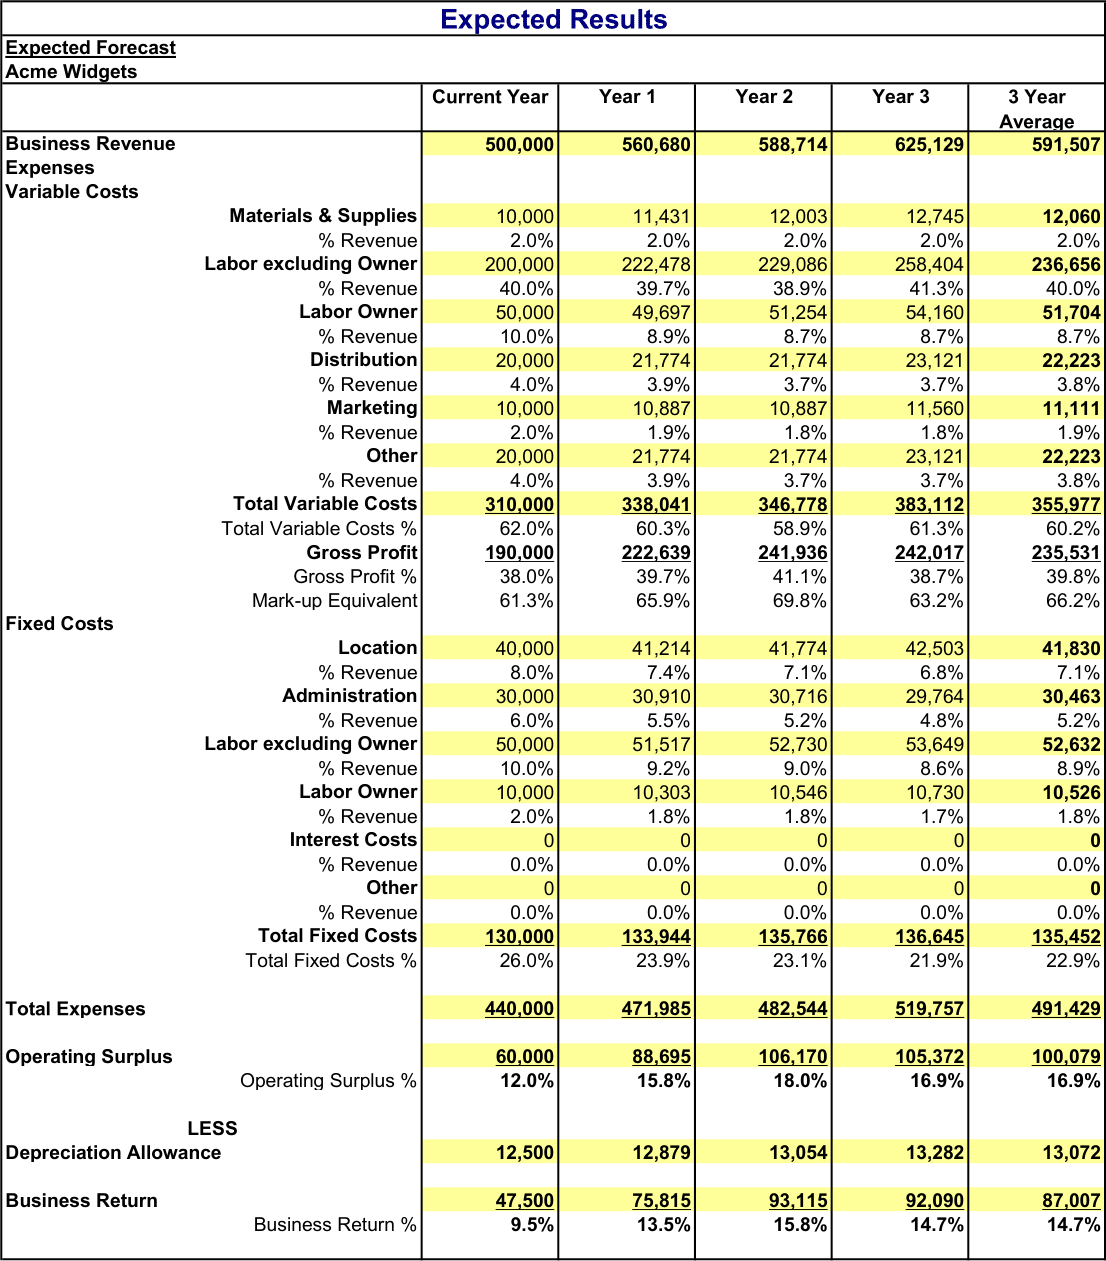
Expected Results
Full tabular results for your Expected Forecast.
Optimistic Results
Full tabular results for your Optimistic Forecast.
Pessimistic Results
Full tabular results for your Optimistic Forecast.
Forecast Revenue Chart
3 Year Forecast Revenue Chart; Optimistic, Expected and Pessimistic.
Forecast Surplus Chart
3 Year Forecast Operating Surplus Chart; Optimistic, Expected, and Pessimistic.
Forecast Return Chart
3 Year Forecast Return Chart; Optimistic, Expected, and Pessimistic. Return is the Operating Surplus less the Depreciation Allowance.
Operating Surplus Chart
3 Year Expected Operating Surplus Chart including Variable and Fixed costs.
Budget by Month Master
The Budget by Month Master builds a monthly budget for your Year 1 Forecast. This is done by using the Current Year and Year 1 Forecast data. Revenue for the budget year consists of 2 components. Base Revenue, which is the same as the Current Year (no change year on year), and Growth Revenue, which is the difference between Current Year Revenue and Year 1 Forecast Revenue. Base Revenue is allocated to each month according to the Percentage Contributor you input for the month. If all months contribute equal revenue the Percentage Contributor will be 8.3333% (1/12) for all months. This is unlikely as the revenue of most businesses tends to vary due to seasonal influences such as weather, holiday periods, etc. Your Percentage Contributor is used to incorporate these revenue variations.
Growth Revenue is distributed across the months by considering the Percentage Contributor and the Compounding Growth Affect. If you secure one new customer a month to generate your Growth Revenue then in month 1 you have Growth Revenue from one new customer, in month 2 you have Growth Revenue from 2 new customers (the customer secured in month 1 and the customer secured in month 2). This Compounding Growth Affect is adjusted by the Percentage Contributor to calculate the amount of Growth Revenue allocated to each month. Imagine the Percentage Contributor for month 2 is half that of month 1 due to seasonal factors halving the number of customers in month 2. The average number of new customers you could secure in month 2 will also be halved by this downturn in demand resulting in a decrease in the amount of Growth Revenue that can be secured.
Total Revenue for each month is Base plus Growth Revenue. Variable expenses are calculated as a percentage of Total Revenue based on your Year 1 Forecast. Their actual amount varies with revenue but their percentage remains constant over the year. Fixed Costs and Depreciation Allowance are allocated equally over the months based on your Year 1 Forecast. Their amount remains constant regardless of revenue variations.
Budget Month
Input the first month of your budget year. Following months are calculated as the preceding month plus 31 days.
Percentage Contributor
For the first 11 months of the year input the Percentage Contributor indicating the percentage of annual revenue the month would provide if there was no revenue growth. The percentage for the 12th month of the year is calculated to ensure the annual total is 100%. Use the 12th month percentage as a check on your inputs. The Base Revenue for each month is calculated as the Percentage Contributor multiplied by the Total Base Revenue for the Budget Year.
Budget by Month Master Chart
View Revenue, Operating Surplus, and Business Return for Year 1 as built by the Budget by Month Master.
Budget by Month
Budget by Month allows you to update all cell data to match the Budget by Month Master when you click an Update All Button; update cell data to Master by row when you click the adjacent Update Button; and change any input within a blue cell by simply overwriting the existing data. This allows you to fully refine your budget and recalculates all percentages and totals based your inputs. Adjusting revenue and expense amounts will change your budget ratios i.e. Variable Cost % etc, beware. If you believe major adjustment is required it is recommended you review and adjust your Input Sheet data to generate an improved Master Budget. You can then refine it here to produce your Budget by Month. When you click an Update Button any existing data in the updated cells is overwritten and can not be recovered. It is replaced with data from the Budget by Month Master.
Budget by Month Chart
View Revenue, Operating Surplus, and Business Return as defined in Budget by Month.
Forecast Budget Download Help License +bizpep.com
License Forecast Budget
Please consider supporting application development. Licensing your application will fully enable all functions.
License your application now
$69.00 USD per year
Secure online transaction processing is provided via PayPal. License details are sent by email as soon as your transaction is processed and will fully enable your application.
Application suitability must be independently assessed and use indicates acceptance of any and all associated risk.
Forecast Budget Download Help License +bizpep.com

Thanks for your quick response and great product.
Bill Stansky
My rating is #1. What I like most about the budget forecast model is the method of forecasting that relies mostly on management experience and judgment and awareness of the business environment in lieu of statistical techniques.
Paul McNamara
Thanks. You are making my life a lot easier with this tool as I plan for my new business and prove my projections to my private investor.
Emmett Kaericher
Every thing is working great.
Larry McKaig
...overall very good product. Thank you.
James Pagano
It allowed me to intuitively learn how to use it and do what I needed to do in much less time than it would have taken me to perform my analysis from scratch, and made a good looking report that I was able to use and present. It is great for rapid analysis...and would recommend it to others.
Michael Cline
I really like what you've done
Steven Karp
You are amazing. I have never seen a software provider caring about the end users and inviting their comments.
Krish Sethumadhavan
You guys are fantastick ...excellent service each and every time, without fail.
Ron Scott
...you guys were great!
Doug Ingle
I'm very impressed with your service and response. I wish all companies could be like this.
Michael Bolt
It is really a pleasure to have done business with you and your company. You are prompt, pleasant and always there when I needed you. Keep up the good work.
Imtiaz Abdulla
Keep up the good work!!
Bruce Frey and Maggie Cosgrove
Great as usual, Thanks.
Otto Stromfelt
Excellent for the three items.
Andres Duany
These are practical business tools and the service that you offer for modification and assistance to adapt to practical circumstances is outstanding.
Ian Fortuin
I really appreciate your time and responsiveness... I'll definitely be back to your site soon.
Ray Bennett
I like the simplicity and layout of your product.
Mark Holmes
This was my first software purchase over the internet. I am very please with the results.
Bonny Nichols
Whole transaction and result well done.
Brian O'Donohoe
Thank you sir for your prompt response and excellent service.
Jamshir Nasimi
Your help has been great!
Kathy Long
Thank you VERY MUCH for your help. I will be buying the program in the next few days.
Pete Brown
Thanks. Great service as always.
Tim Baugh
Thank you for your quick and helpful response.
Marjorie Lorimer
Thank you for the quick and effective response.
Dick Gibson
I've been very impressed with your customer service.
Phil Fleet
I recently purchased your software, which I think is great.
William Roach
Thanks. I love your stuff!
Kenny Pearmain
Worked like a charm.
Rob White>
You guys are great!
Dennis O'Block
Great product.
Jan Jacobson
... really impressed.
Chris Nagel
I think you have a great solution.
Ken Roach
...I'm extremely pleased. It shows very clearly what I've suspected.
Mervyn Groves
... the software performs very well.
Paul O'Dwyer
Your revisions to my code worked perfectly!
Kim Chapin
Thanks for your excellent results.
Bud Reed
...we highly recommend ...
Barbara Stafford
Really like the spreadsheet!
Gary Ellinger
I like the software very much.
Phil Thomas
Everything worked great! Thank you very much. I will be sure to refer your script as I meet people who need it :). Overall I am very satisfied with my experience using your solution.
Kyle Rodeck
Thank you so much...The file works great.
Dane Young
I just bought your scripts and they work great...Simple and worked perfectly, thanks...Did exactly what I needed it to do.
Pete Friebel
You were quick to respond and your product worked seamlessly.
Greg Gossler
I appreciate your assistance and your support. I will spread the word...I'm very much impressed.
Paul Forman
Thanks David. Your customer support is very impressive. I will refer more people to your company.
Syed Ali
I just purchased and I've got to tell you it's super easy to use and your directions are extremely easy to follow and understand... and at such a reasonable price. Thanks for your time and thanks for creating such a fine product!
Kenneth Brodeur
Thanks again for your concern and solution to our problem issue. We will gladly recommend your company...
Alan White
Thank you very much indeed for your help. I have recommended two of my clients purchase your script so far, and will continue to do so.
Mat Greenfield